
New data shows the greenhouse gas emissions. Although the data was released in 2026 it was based on source data from 2024. Apparently, that’s how long it takes to apportion national CO2 emissions to the regions.
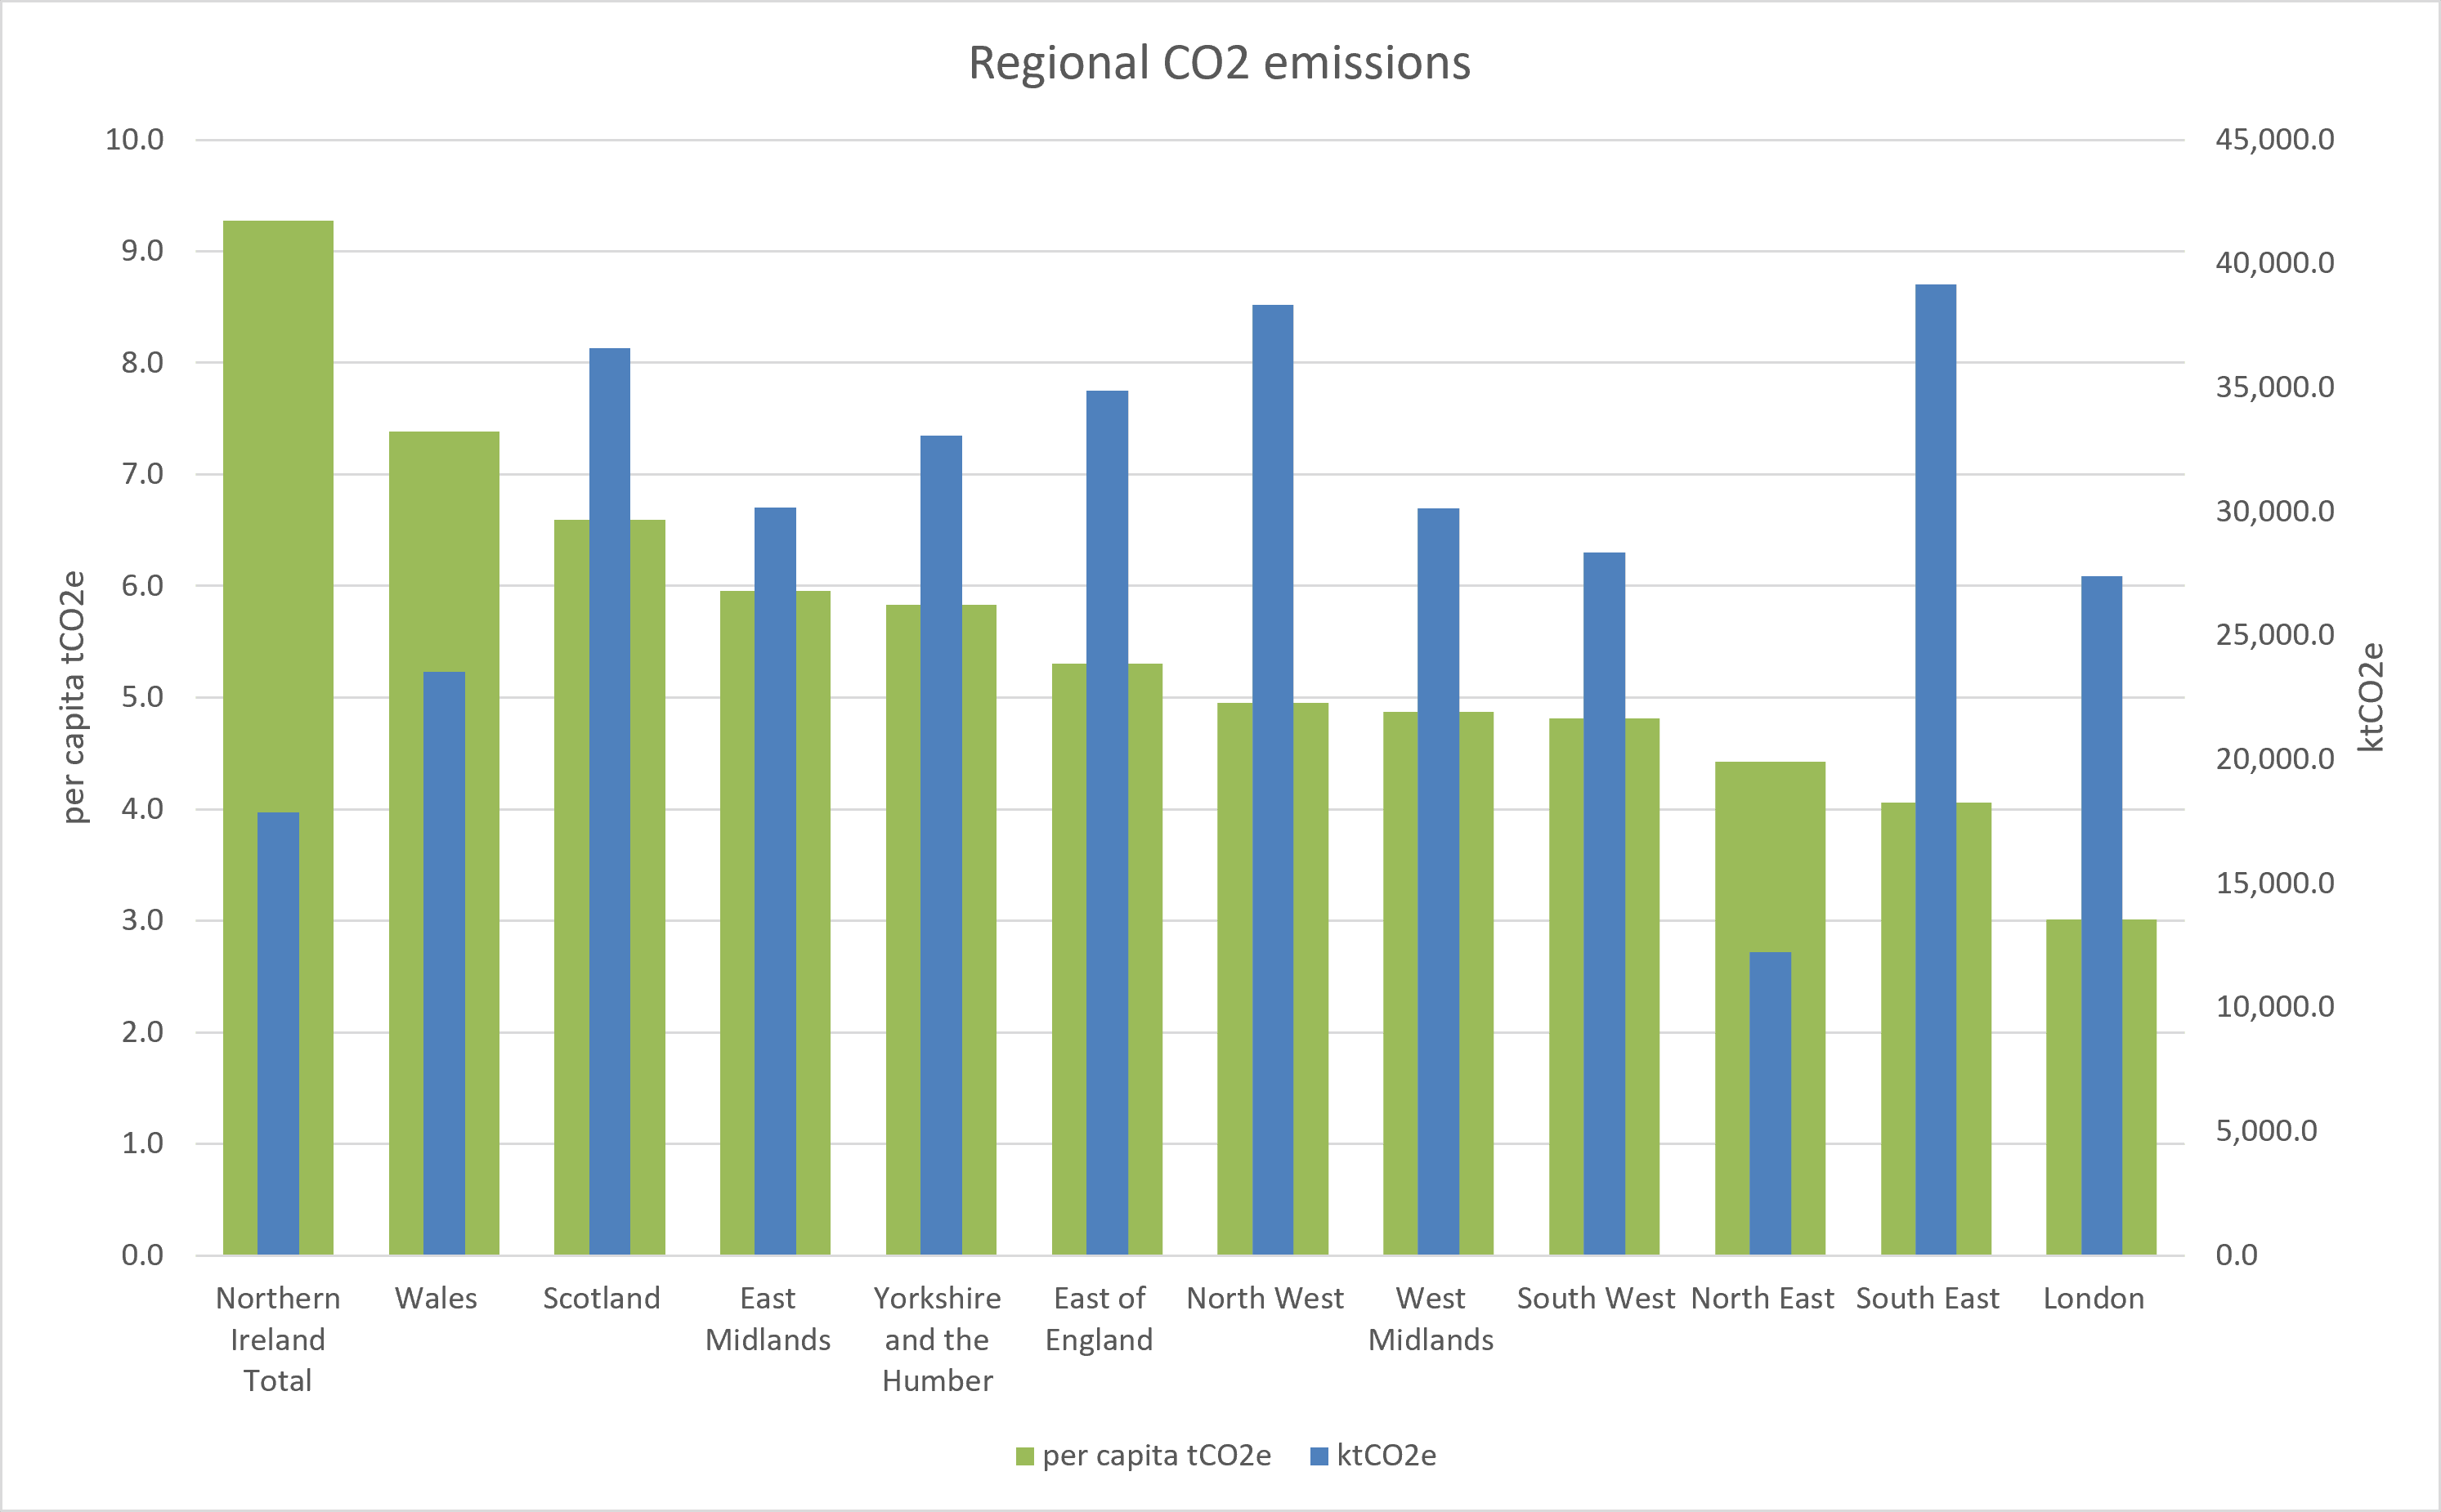
The chart below shows the splits between regions:
The chart shows the absolute CO2 emissions in each region, but as each region has differing populations, it is a good idea to look at emissions per capita. The document issued with the statistical release identifies:
- Northern Ireland has the highest emissions per capita from the agriculture (3.0 tCO2e per person), land use, land use change and forestry (1.1 tCO2e per person), domestic (1.6 tCO2e per person), and waste (0.5 tCO2e per person) sectors.
- Wales has higher emissions per capita than all countries and regions other than Northern Ireland due to it having the highest emissions per capita from the industry sector (2.1 tCO2e per person), reflecting its higher level of industrial installations. It also has high emissions per capita from the agriculture sector (1.6 tCO2e per person).
- Scotland has higher per capita emissions than the UK average in almost every sector, in particular from the agriculture sector (1.4 tCO2e per person), land use, land use change and forestry sector (0.4 tCO2e per person) and public sector (0.2 tCO2e).
- London has the lowest emissions per capita of any region at 3.0 tCO2e per person due its urban transport system, high population density and lower level of large industrial installations and agricultural land.
The document also has commentary about different sectors. As we work with lots of UK housing associations, the domestic sector was of particular interest. Observations include:
- Between 2005 and 2024, domestic sector emissions decreased in all local authority areas.
- However, there was a 1% increase in domestic emissions between 2023 and 2024. The easing of energy cost pressures is likely to have been a factor in increased gas use for heating buildings.
- Higher emissions per capita in Northern Ireland are largely due to the limited availability of natural gas in the area; this results in greater use of more carbon intensive fuels such as coal, burning oil and gas oil.
Due to our ESOS compliance work, we are also interested in the commercial sector:
- Between 2023 and 2024, commercial sector emissions fell by 8% across the UK, mainly due to lower emissions from electricity use. And there has been a long-term fall.
- This long-term fall is mainly driven by the reduced emissions from electricity use, largely due to decreased coal use for electricity generation and increased use of renewables.
- Only one local authority region saw an increase. This was Slough, where commercial sector emissions increased by 39% between 2005 and 2024. This increase may be due to the large number of data centres that have been built there.
What next?
No matter your region or sector, CO2 emissions still need to come down. Here are a couple of things you can do:
- By all means use this data for your own sales and/or political campaigns
- If your organisation wants effective environmental reporting for CO2 reduction strategies, compliance or for other stakeholders, please be in touch for an initial discussion on how we can help.