Introduction
There are emerging global and national agendas on placemaking, levelling up and wellbeing. Investors are looking at environmental and social factors of the organisations they lend to for their ESG investments. This trend aims to improve the places where people live and improve the long-term wellbeing of the people that live there.
Despite these agendas there is no single, science-based metric that describes all these important features of an ideal place to live. Consequently, investors or policy makers are often unaware whether their decisions achieve their intended purpose. Here at SHIFT Environment, we believe you can only properly manage what you measure.
Therefore, using Maslow’s famous hierarchy of human needs as a framework, we decided to put together a set of environmental and wellbeing data and assemble it into one single science-based overarching metric.[1].
The “Basic” and “Security” needs of the hierarchy underpin the ability of people to achieve the higher needs such as “social connection”, “esteem”, and “self-actualisation”. Under Maslow’s theory, fulfilment of these needs is indicative of a highly contented person.
We’ve categorised environmental statistics in the security section because protecting our environment is essential to the supply of our very basic needs for food, water, clean air and shelter. These are all under threat if we do not protect the environment in which we live.
The idea is that if a region has low environmental impact and the people in that region are happy, then that region scores a higher percentage of needs met. Conversely, if there is poor environmental performance in a region and the people are unhappy then there will be a much lower percentage of human needs met.
[1] A fuller explanation of using Maslow as a framework for placemaking is in the book “Happiness by numbers”. Here’s a blog on the book: https://shiftenvironment.co.uk/news/happiness-by-numbers-how-to-measure-and-manage-your-wellbeing-to-make-a-positive-impact-on-the-world/
Here is what we found:
The results
The data shows the extent to which the people in each region have their needs met and ranking. According to this data, the southeast region of Great Britain has the highest ranking at 79.6%, and Scotland has the lowest ranking at 77.9%.The full data table is below.
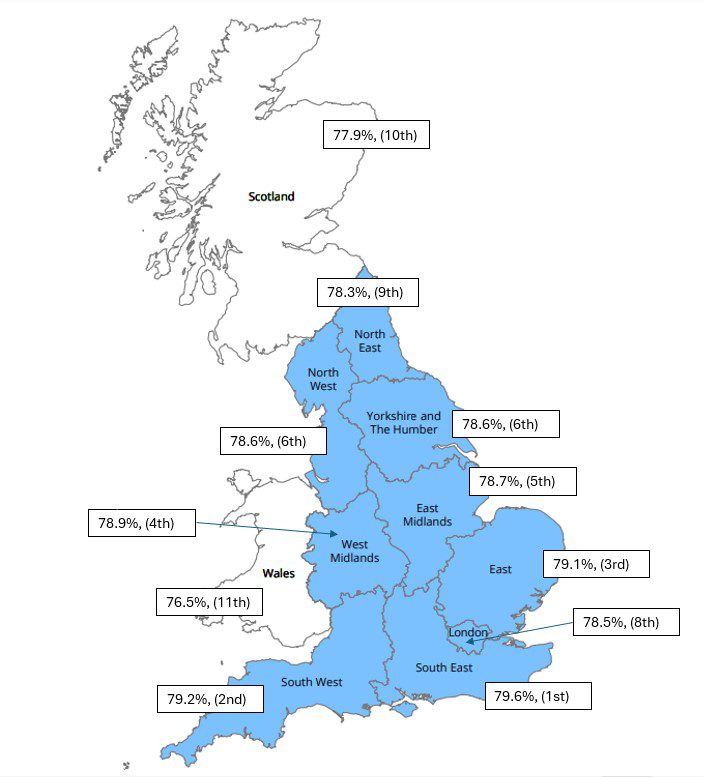
Map image: Source: Office for National Statistics licensed under the Open Government Licence v.3.0 Contains OS data © Crown copyright and database right 2023
So what?
We present this data for a number of reasons:
- To show that these things can be measured in a science-based way and therefore can be managed
- Inspire those in authority to implement more plans to improve the interlinked issues of both environmental performance and human wellbeing in their respective regions
- Highlight gaps in current data sets
- Show that more regional level data is required on a more regular basis so that feedback can be used to influence plans sooner rather than later
- Create a baseline for where we are right now so that we can compare performance in future years
- Inspire interregional competition to become the first to reach 100%
- Inspire organisations located in those regions to contribute to making better places in a measurable way
- Create a way forward on a statistical basis to allow people who live in the regions to hold those in authority to account
Hopefully a simple chart like this does all these things!
Dataset
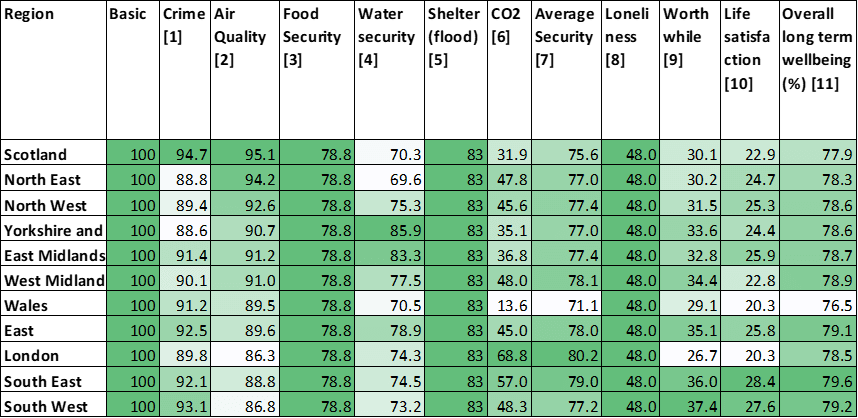
Table data sources:
[1] Scotland data: 528 crimes per 10,000 so 94.72% secure, https://www.gov.scot/publications/recorded-crime-scotland-2022-23/pages/4/
[1] England and Wales data: ONS data by Police Force Area – inverse of crimes per 1,000 people
[2] Daily Air Quality Index (DAQI) data for 2023 – regional data assigned as close as possible https://uk-air.defra.gov.uk/data/DAQI-regional-data
[3] Global food security – data only available at national level: https://impact.economist.com/sustainability/project/food-security-index/
[4] Discover water data – regional data assigned as close as possible. Ideal water efficiency is 110 lpd in England and Wales and 130 lpd in Scotland: https://www.discoverwater.co.uk/
[5] Flood risk – no regional data so EA headline of 1 in 6 homes at risk of flooding used: https://assets.publishing.service.gov.uk/media/5a7ba398ed915d4147621ad6/geho0609bqds-e-e.pdf
[6] So much of our basic needs dependent on CO2 so regional CO2 detailed here – “closeness to net zero” – formula = % improvement from UK national 2005 per capita CO2
[7] Simple average as they all need to be 100%
[8] ONS personalwellbeingandloneliness13dec2023to1jan2024.xlsx no regional data = % of people who report “Hardly ever or never ” get feelings of loneliness
[9] ONS from “wellbeing aprtojune23nonseasonallyadjusted (1).xlsx”
[10] ONS from “wellbeing aprtojune23nonseasonallyadjusted (1).xlsx” – % of people with very high satisfaction levels
[11] Weighting 50% basic, 25% average security, 10% social, 10% worthwhile, 5% life satisfaction