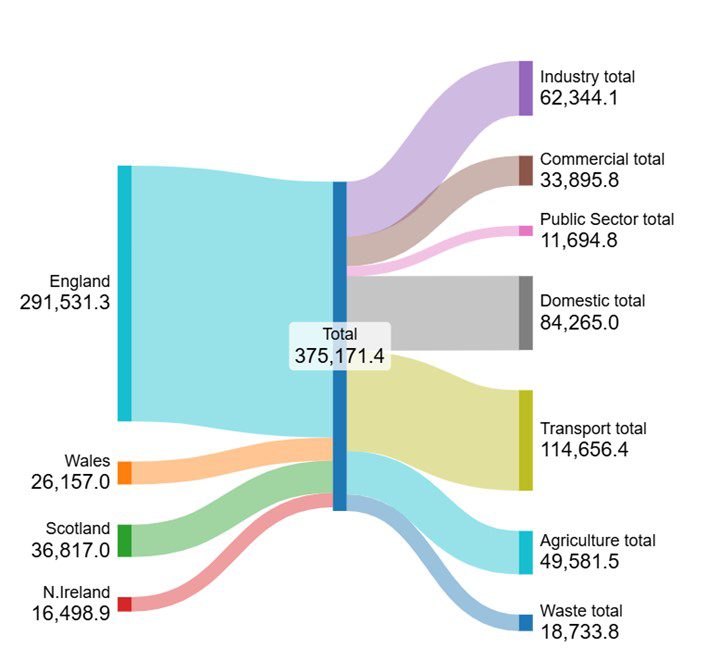
The latest data on local authority territorial greenhouse gas emissions is out [1]. Readers mustn’t get excited about the word “latest” because the data actually relates to 2022. The delay is due to the time required to collect and quality assure the data. The diagram below shows that just over 375 million tonnes of CO2e was emitted by us. It also shows how those emissions are split by sector and country.

A few notes on the data:
- These are UK territorial emissions and aviation emissions are excluded (aviation could add another ~30 million tonnes)
- Embodied CO2 of stuff we buy and import from other countries is also excluded (these could add another ~360 million tonnes)
- We have omitted land use changes in our chart because they are relatively small (0.8 million tonnes) and unnecessarily complicate the picture
- Emissions that cannot be reasonably allocated to local authorities (which could add another ~9 million tonnes)
- There is more recent data but it is provisional and does not split down into different local authorities
The good thing about this particular dataset is that it allows people to track how their local authority is doing. We are based in Stroud, Gloucestershire and here is how we compare.
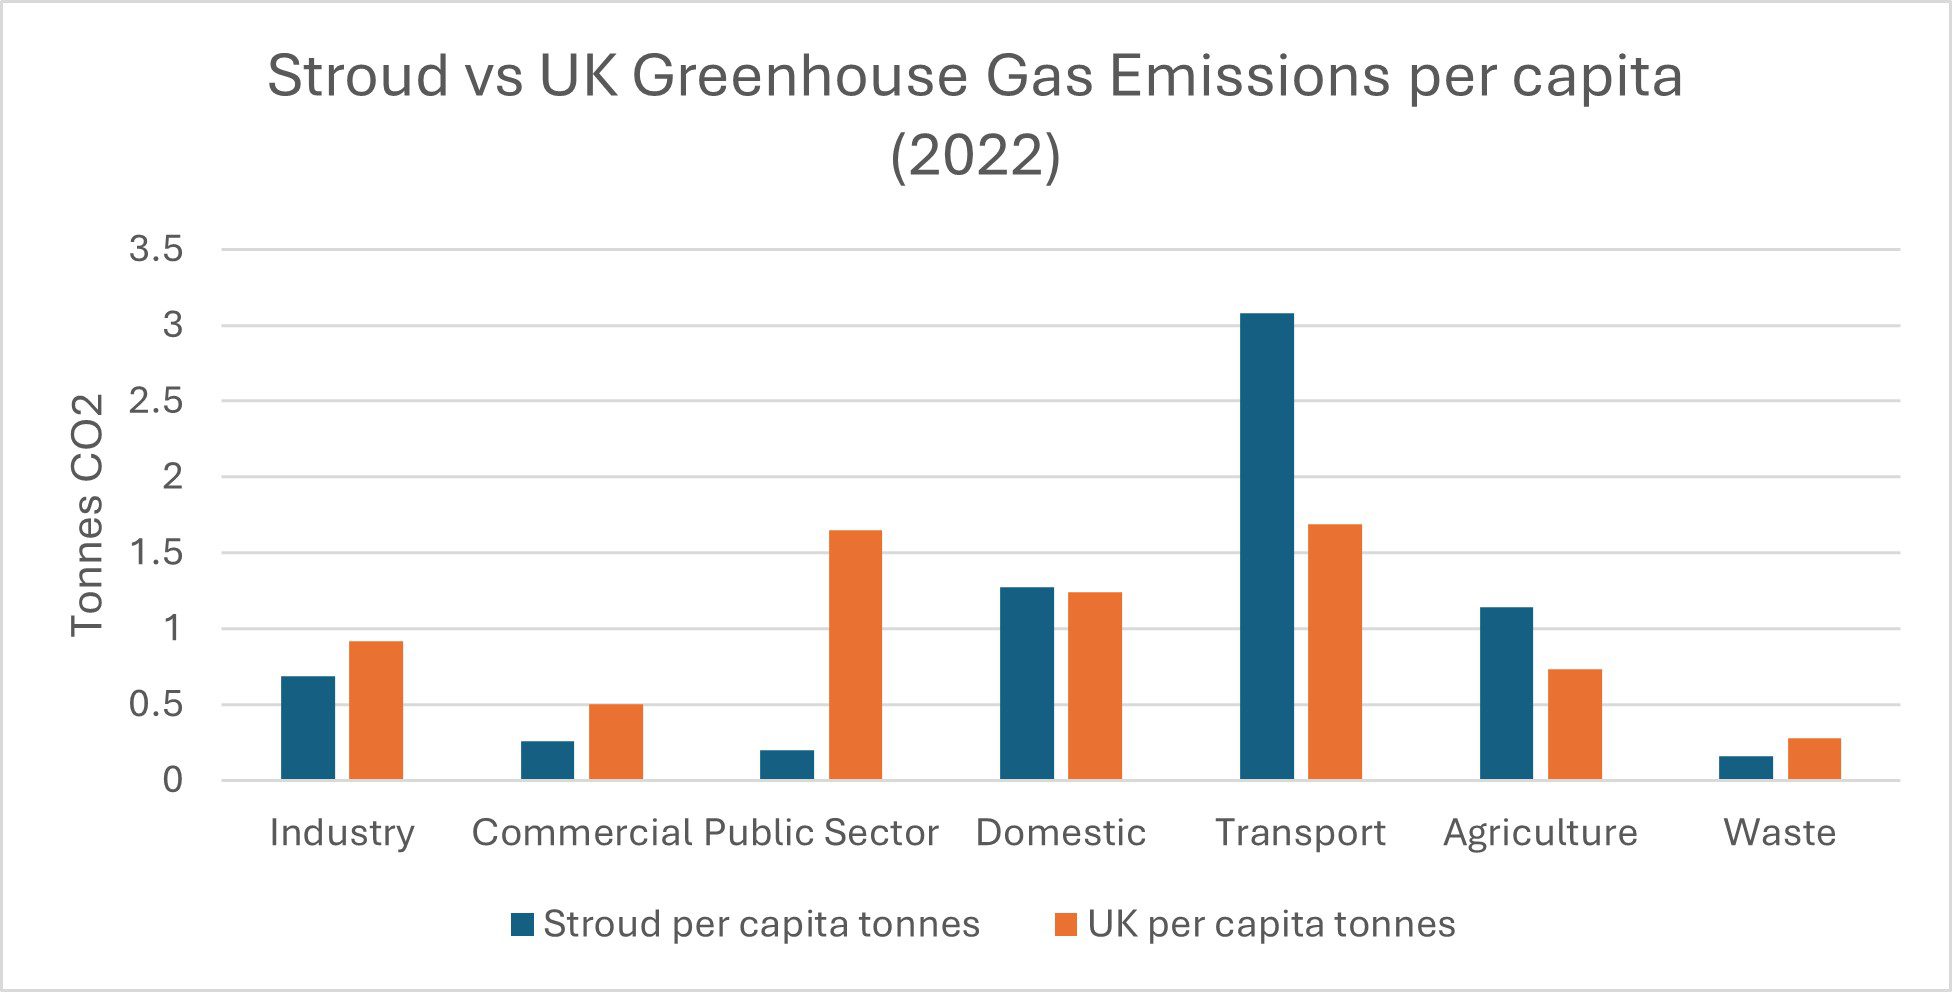
All of these need to be zero by 2050 and there is a national net zero pathway for each of these sectors. The sooner that organisations and individuals in each of those sectors take action, the easier it will be to achieve net zero.
In an ideal world, avoiding the worst effects of climate change and natural destruction should be justification enough to develop their own strategy. So, it is good to know that taking action on sustainability can lead to significant financial benefits too. For businesses these include:
- Increased sales
- Improved staff retention
- Savings on energy costs
- Raise investment
Part of the picture of achieving all of this is accurate environmental reporting. SHIFT Environment specialises in this kind of reporting for those in the built environment. Clients use our reports for:
- Strategy development (getting a baseline, identifying targets and actions)
- Third party and independent assessment of environmental performance
- Compliance reporting (SECR, ESOS, EPC)
- ESG reporting to attract investors
Take a look at our services to see which ones suit you best and then please be in touch to see how we can help you.
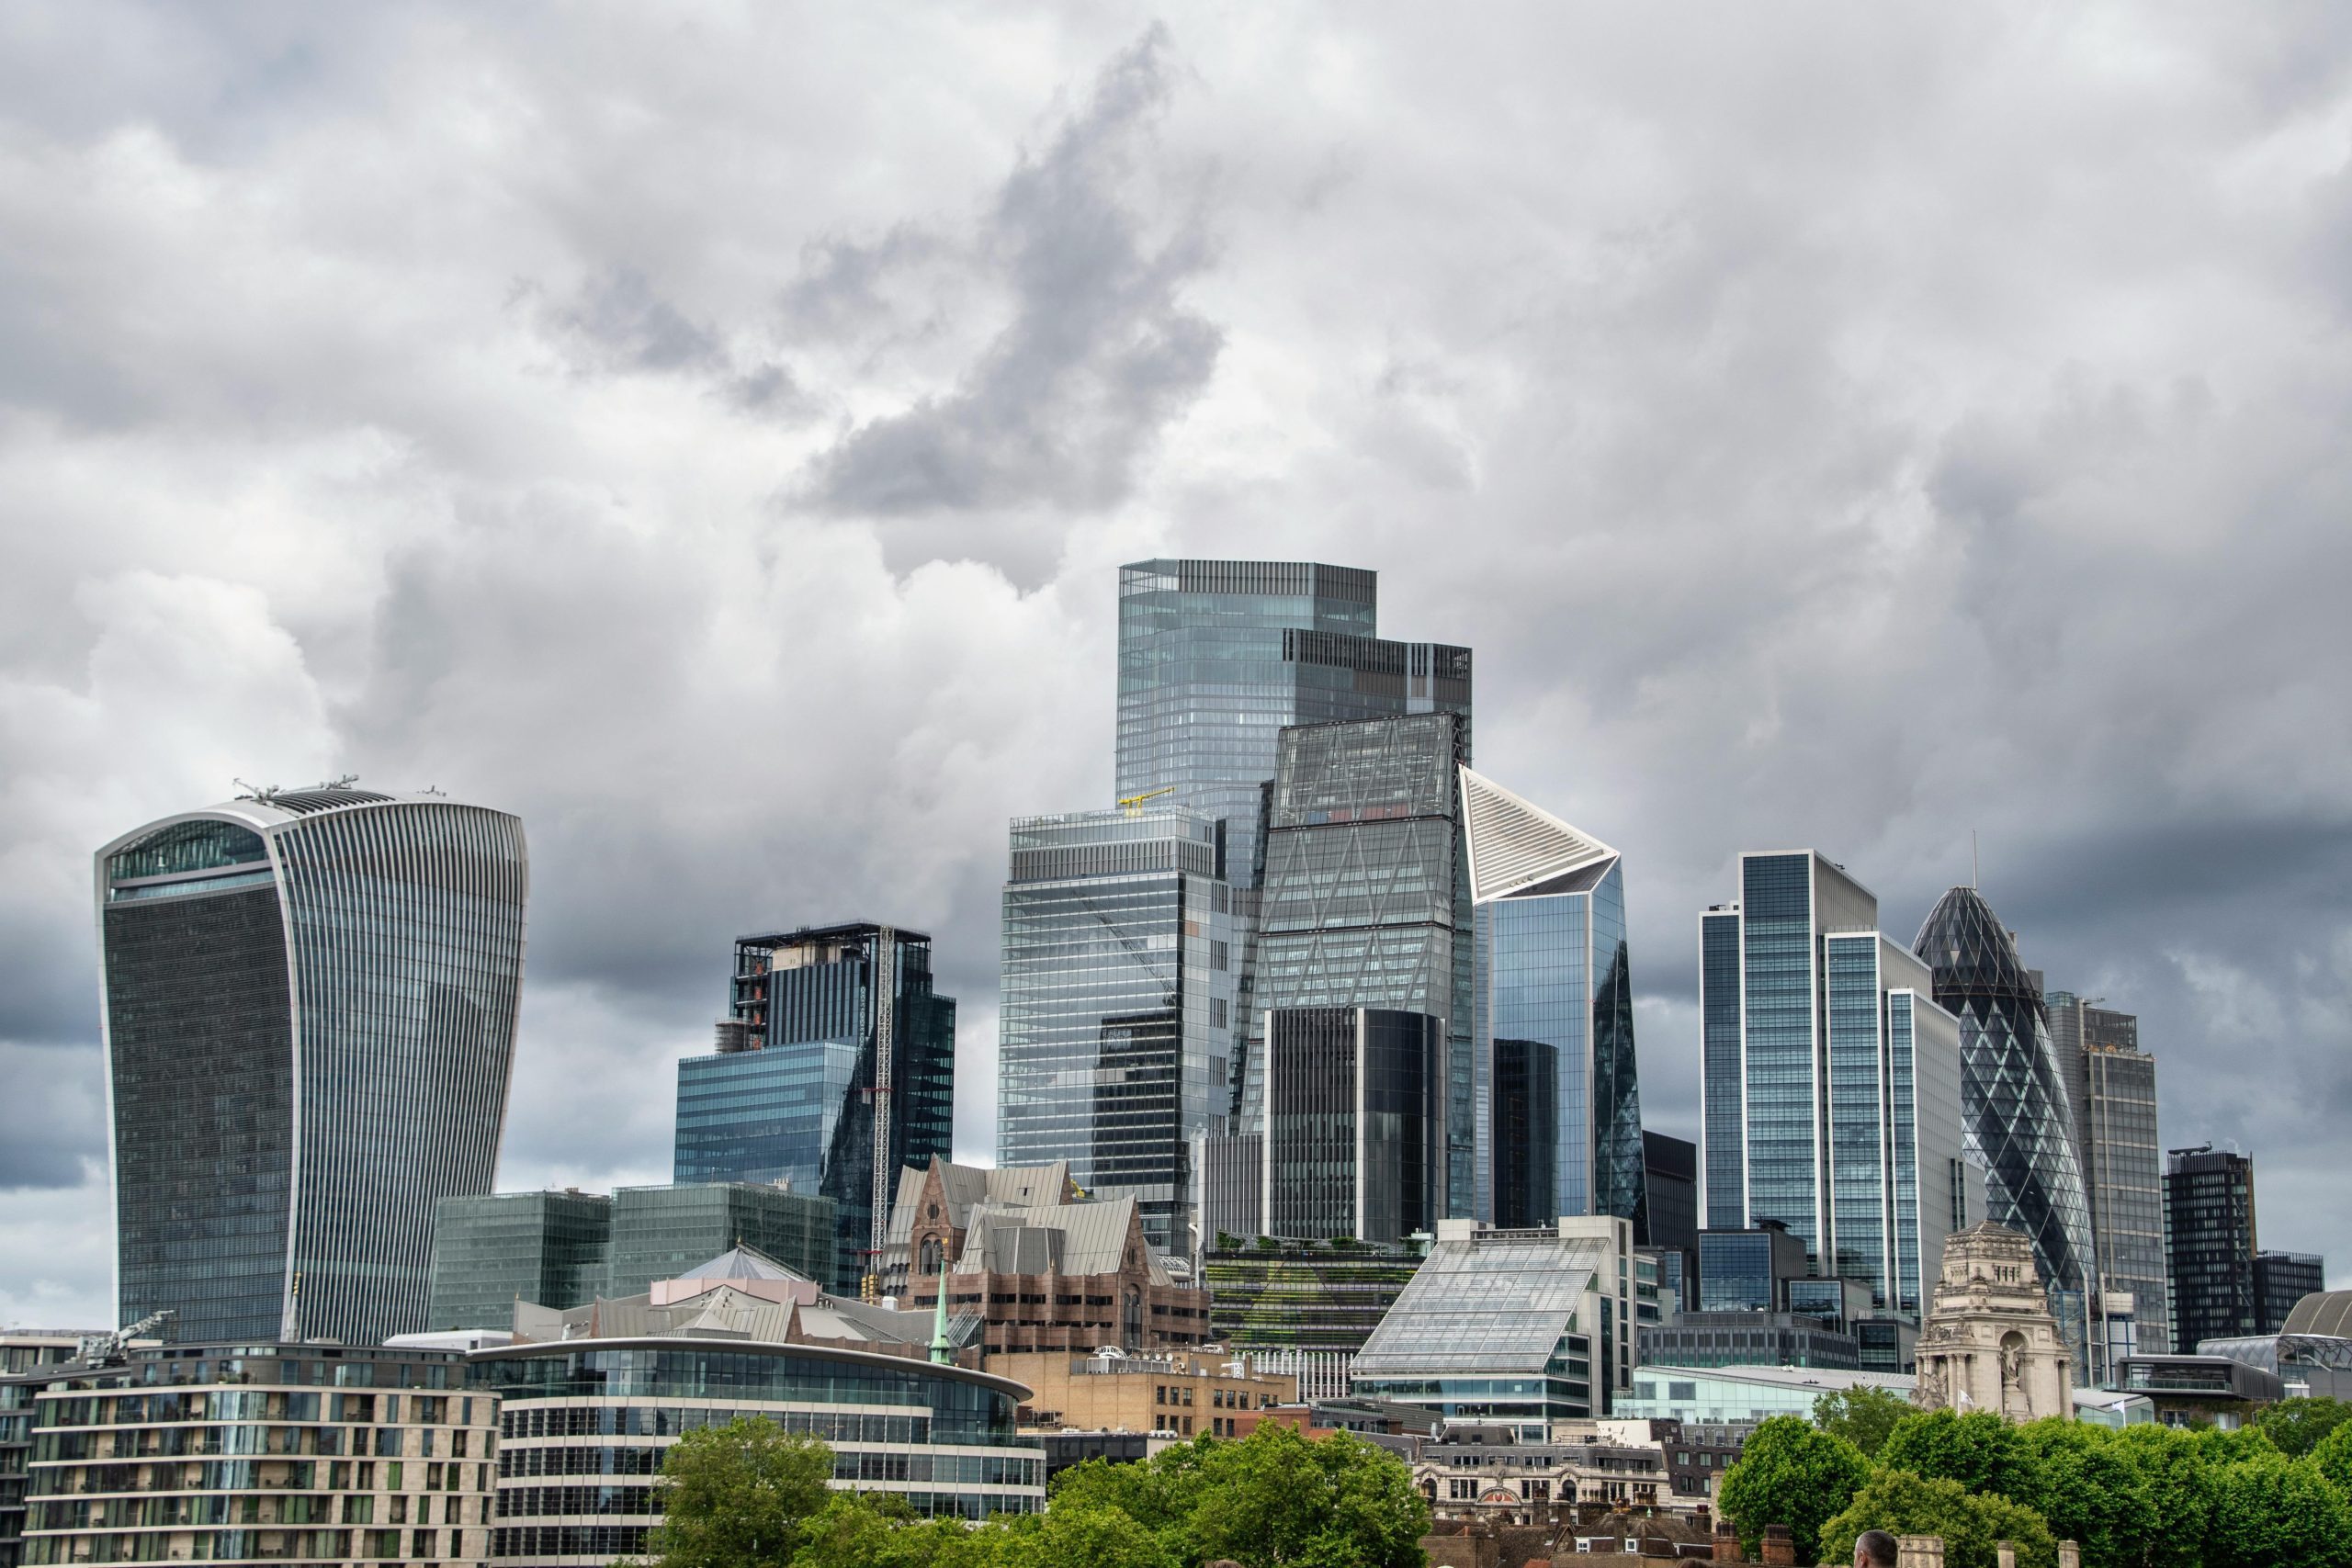
[2] Photo by Enrique: https://www.pexels.com/photo/skyscrapers-in-the-city-of-london-in-uk-26568610/